Data measured by the Assioma power meter pedal
About ProductsThe Assioma power meters pedals offer the possibility to have a comprehensive and detailed understanding of your pedalling style also thanks to its strategic position. In fact you will not only be able to see your total power but also many other useful data. Let’s see it in more details:
Left/right balance
It shows as a percentage the power separately put out by the left and right leg. The L/R Power Balance allows you to monitor the dominant/non-dominant leg ratio and observe how this varies in relation to different racing and fitness conditions. This can be particularly useful to work on your imbalances, also in post-traumatic rehabilitation programs.
Unlike others, the Assioma power meter pedals convey this metric as a real dual-sided value, and not estimates (see Table).
| Power sensor | Single | Single | Double |
| Sensor position | One side only | Centered (spider, bottom bracket, hub) | On both left and right side |
| Total power data | Estimated | Real | Real |
| L/R Balance data | X | Estimated | Real |
Table 1. Comparison of Different Types of Cycling Power Meters.
Cadence
It represents the number of the pedal revolutions per minute (rpm).
The built-in cadence sensor of Assioma constantly transmits this value to the bike computer: the use of a separate cadence sensor is, therefore, unnecessary.
IAV Cycling Dynamics

These additional metrics are transmitted via the ANT+ channel. Among bike computers and watches, only Garmin has implemented the capability to display them, and even then, only on select devices (see FAQ U30).
Additionally, they can be viewed live on the Favero Assioma app when using any of the Assioma PRO line pedals.
The Cycling Dynamics are:
- PCO, also called Platform Center Offset
The PCO is only available for the Assioma PRO line.
The PCO is calculated by identifying how force is distributed across the pedal platform during the pedal stroke throughout a specific period of time. This data is useful to understand where force is applied relative to the center of the pedal platform, which is particularly useful, for e.g., to fine-tune the positioning of the cleats, improve your cycling style and prevent injuries.
-
Power Phase (PP)
It represents the segment of the pedal stroke where positive torque is produced. In this phase, over 90% of the propulsive force that moves the bicycle forward is generated.
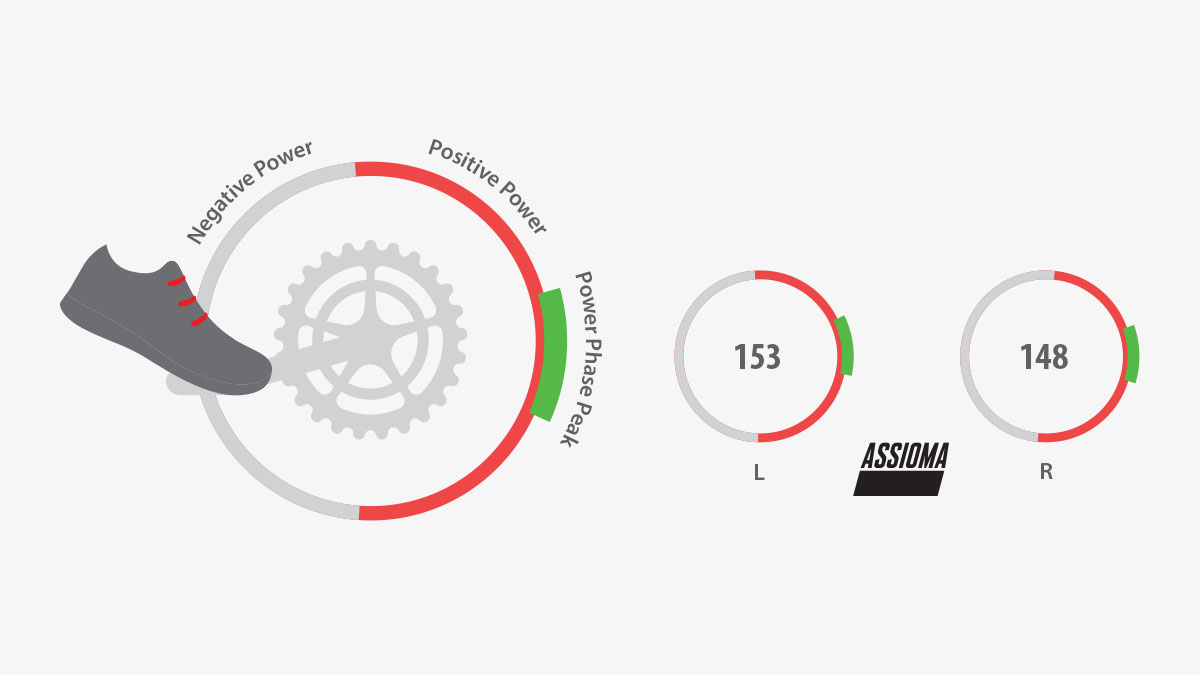
The Graphic above shows the power produced during a single pedal stroke. The Power Phase represented by the red segment of the circumference outlines where power begins and ends.
The green sub-segment, instead, is the Power Phase Peak (PP) and shows where the majority of power is produced during a single pedal stroke. Most head units consider the Power Peak Phase as a value higher than 50% of the power output but this can be changed depending on your preferences.
-
Rider Position
It shows how much time a cyclist stands on the pedals or remains seated.
This metric, together with the registered track, permits to analyze the trend of the cyclist to change position on the bike during particular moments of the ride, in other words to understand how a specific position can affect the performance.
Assioma UNO provides these values for the left leg only whereas Assioma DUO for both the left and right leg.
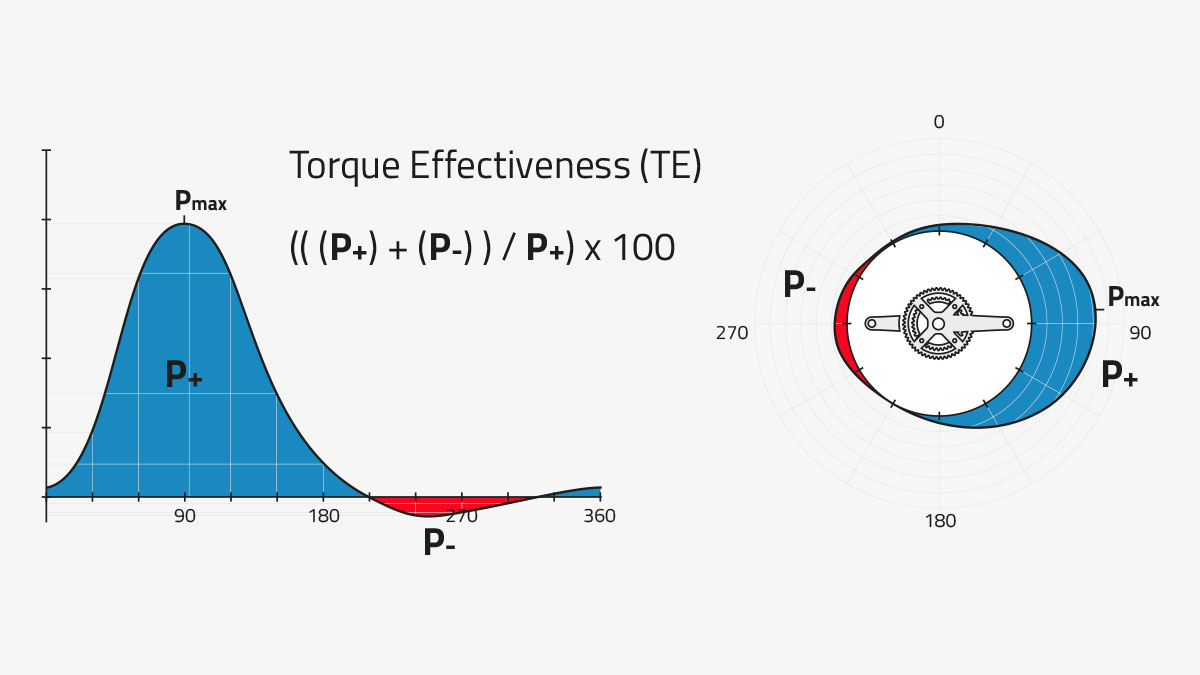
Torque Effectiveness (TE)
It represents as a percentage how much of the power generated during the pedal stroke actually contributed to the propulsion of the cyclist.
This value is calculated each revolution as follows:
(( (P+) + (P-) ) / (P+) ) x 100.
(P+) stays for Positive Power, that is the power needed to push the pedal forward, whereas (P-) is the Negative Power, that is the power that pushes in the opposite direction. Negative Power can be countered by trying to pull the foot up on the backstroke.
A 100% Torque Effectiveness occurs when no Negative Power has been accumulated during a pedal stroke. The typical Torque Effectiveness value may vary between 60% and 100%.
Assioma UNO provides this value for the left leg only whereas Assioma DUO for both the left and right leg.
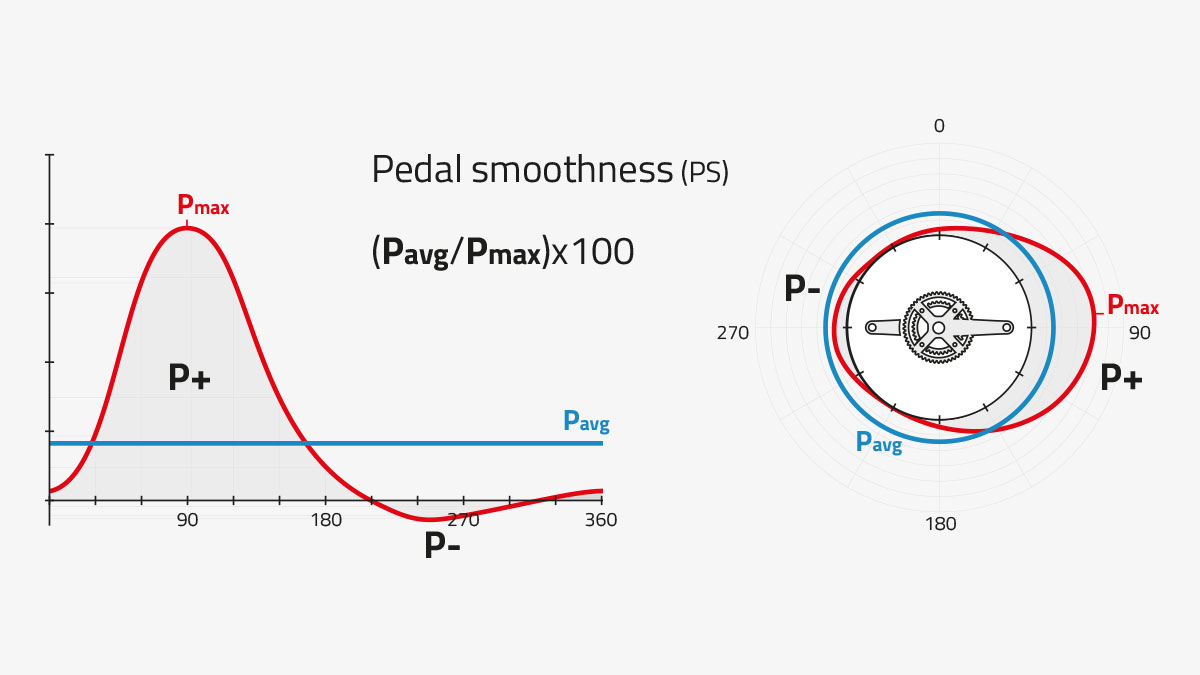
Pedal Smoothness (PS)
It indicates as a percentage how evenly distributed power is throughout the whole revolution of a pedal stroke. A value of 100% means that power is delivered constantly throughout the whole revolution: the higher the value the "rounder" the pedaling.
Pedal Smoothness is identified by correlating the Average Power (Pavg) with the Maximum Power (Pmax) measured in a single 360° rotation of the pedal.
Assioma UNO provides this value for the left leg only whereas Assioma DUO for both the left and right leg.
Other parameters
There are other parameters we can observe if calculated by your bike computer based on the data transmitted by Assioma:
- NP® (Normalized Power®)
- IF® (Intensity Factor®), Power Zones (Z1 to Z7)
- TSS® (Training Stress Score®)
- ACL®
- TCL®
- Energy Consumption
- FTP Power
- Power-to-Weight Ratio
- W'Bal® (Work Balance)
- Wbal®
Read the other articles
- Assioma PRO RS: precision on the road, power at your feet
- The core of Assioma PRO
- Advantages of Rechargeable Batteries in Pedal-Based Power Meters
- Rock solid reliability
- How to install the Assioma PRO pedals
- Rechargeable battery vs. Replaceable battery?
- Assioma’s uniqueness
- The resistance of Assioma: tested in laboratory, proven on the road
- The advantages of the IAV Power
- How to Update the Firmware of Assioma
- The Accuracy of Assioma: consistent and guaranteed
- Install Assioma just like a common pedal
- Assioma Recharging System: Smart and Green
- Assioma DUO-Shi: All you Need to Know